
Most developer wants to be coding, but the reality is that we spent a lot of time reading code, and occasionally a lot of time to get a bunch of little things done: switching branches, digging through code history, step through the debugger, etc. These are a whole bunch of little things that I have learned/discovered in the last 2 years, and none of them are series thing. But when they add up, it makes the day-to-day just a bit easier.
Find Action (⌘ + ⇧ + A)
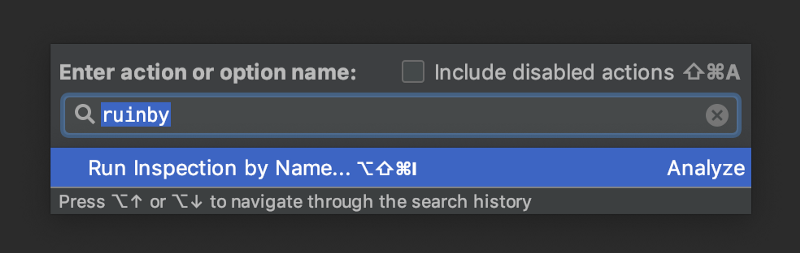
IntelliJ (and subsequently Android Studio) has a ton of useful little things, and the easiest way to use them before you remember the keyboard shortcut is to just find the action. Just remember that 1 shortcut above, and type away. It’s basically the equivalent of Alfred and Spotlight on macOS, and depending on what is being highlighted, which window is focus, what plugin you have installed, etc., it will give you different actions accordingly!
Add and edit Logcat filter configuration
How often has this happen to you: You open the Logcat, and select “Show only selected application”, but for some stupid reason it just don’t see the process. You unplug the cable, and plug it in again, and now the process shows up, but all the old log has been “erased”, but if you select “No Filters”, you can tell that those log are still there. You can just type it in the filter box, but if you app also has a billion other stuff pumping out logs, that’s not exactly helpful. Only if there’s a way to filter log messages based on the package 🤔
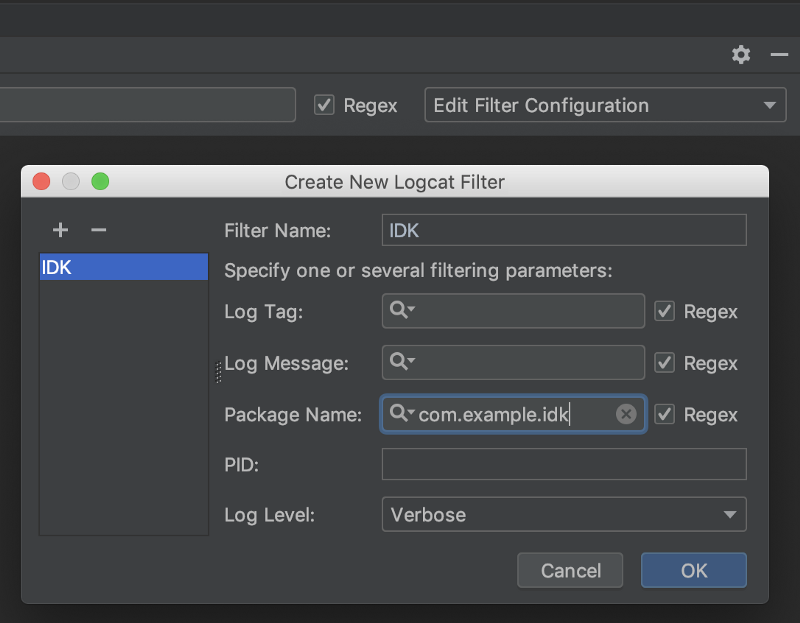
If you click on “Edit Filter Configuration”, you can actually add a new filter that filter the log based package name (and several other stuff)! Unless somehow your package name changes for every build, you can probably setup a filter that always shows log messages of your app, no matter which process it’s on.
Attach debugger
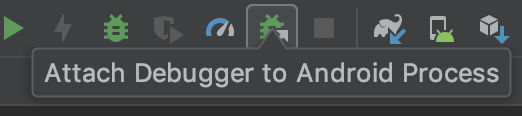
I still feel very stupid for not knowing this exist for more than a year: If you want to debug a debuggable true apk, you don’t always have to run with debugger pre-attached: you can just attach the debugger on the fly. It’s especially useful if your app has a long build time!
Android Profiler or Stetho or Flipper (or Chuck)
While it’s nice to be able to use the debugger, it’s not unusual for us to test “what the hell did I sent to the API”, usually to see if the JSON serialization is correct. For that, there are a lot of options to do that. Here’s the list of tools that I have found over the years:
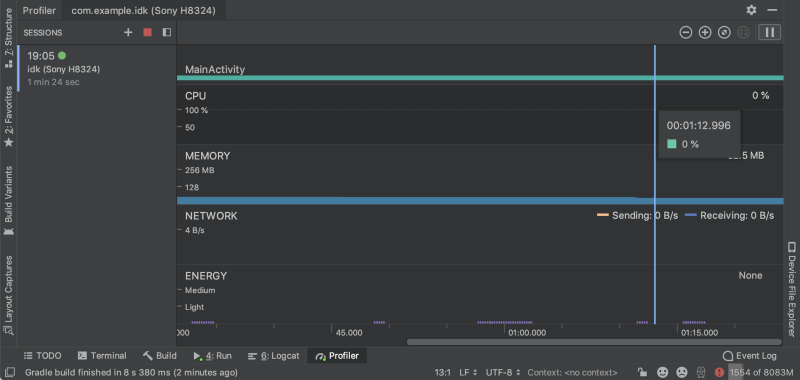
Android Profiler requires basically no configuration, and currently it has the better UX IMO. Not only can you see the timeline of the network traffic, it’s also very easy to see all the parameters, payload, header, everything. It sound’s too perfect, right? Don’t worry, it has 1 potentially major potential flow: it somehow attach itself to the process that your app is in, and it may slow your phone down dramatically. While it makes zero configuration possible, it comes at a higher runtime cost. So depending on your situation, it might not be the best solution for you.
Stetho is a pretty ancient and popular library from facebook, which essentially allows you to intercept okhttp traffic and redirect it to the build-in dev tool of Chrome. It’s reliable, it doesn’t seem like it adds any performance or memory overhead (at least not enough to slow your apps down), and it’s kinda clever how they utilize the great network request timeline. However, since it’s just an interceptor, you are not catching all the network traffic of your app, like all the 3rd party library stuff. Another problem I have with it is that it does not provide good documentation on how to disable it for release build, and during my time of using it in one of my old company, I have see a fair share of apps have that still turned on because of some reconfiguration (probably). And probably because of all the complains and suggestions, facebook created and open-sources a new mobile debugging tool call Flipper, which looks like a decent replacement to Stetho. I haven’t use it a lot, because I am using Linux right now, and Flipper’s desktop client (instead of Chrome dev tool) is only officially available on macOS 😞
One “honorable” mention is Chuck, and it was my favourite network debugger back in 2017. The biggest selling point is that it persist the data locally on device, so you don’t have to plug it in to see what network call is happening. If you just stumble onto a bug, you can just scroll through the list and get it back, and that’s amazing! However, it looks like Chuck has become yet another dead project, and it has not been updated in a very very long time.
Show History (for Selection) & Annotate
Sometimes you look at a piece of code and be like

You can spend another 2 hours digging through the code, or, you can get help from your colleges, ideally the one who wrote that code. Only if there’s a good way to find that out……
Introducing: IntelliJ’s “Show History” feature! With “Show History”, you can see all the change history of a file. And if you selected a section of code, you can even “Show History for Selection” to narrow down the results! Now, with your new found knowledge, locate your college and solve your problem! Just remember, don’t be an asshole.
And just more minor tip: if you right click on the left hand side of code editor, you can use the “Annotate” feature to essentially highlight the last edit time and author of each line. It’s like a quicker version of “Show History for Selection” 👍
Commit and Update project (⌘ + K and ⌘ + T)
(insert mac os screenshot of the 2 dialogs)
IntelliJ basically put steroid on top of git commit, git push, git fetch, git stash, and git pull (-r). “Commit” not only gives you an overview on what has changed, what has been staged, and what has changed but will not be included in this commit, it also has a bunch of extra “hooks” that can run before a commit, such as optimize import and reformat code. It makes it a lot easier to ensure your code follow your team’s guidelines. And on the other end, the Update project feature makes it (usually) 1 click away from pulling the latest change on remote to your local copy of the repository. It fetch from remote, pull from remote, merge or rebase, and if it sees unstaged changes, it can stash it and pop it back out. Obviously it cannot resolve conflicts for you, but for the most part, it reduce the friction of “pulling regularly from remote branch”, and it makes TRUNK-based workflow easier to deal with.
There are a ton of other minor stuff that me and my college uses everyday to make our life easier, and it always depends on your workflow. I hope it help to make your life as an Android dev just a little bit easier!
From Android zero to kinda-middle: a whole bunch of little useful things for your development…
Debug network calls, shortcuts to find out which team member to talk to, and other useful stuff to make life as an Android Developer…